Your exposure is growing. Every quarter.
The invisible liability
Most industrial facilities have no real-time view of their pollution pathway exposure. The first time they quantify it is when a regulator arrives - or when a community health incident makes the news.
The underestimated cost
Carbon tax at R236/tonne CO₂e. Budget exceedance penalty at R640/tonne. NEM:AQA fines. Community health liability. Most operators cannot quantify their actual exposure - so they cannot manage or reduce it.
The stalled investment
Pollution reduction projects stall because finance teams need ROI, payback periods, and CO₂ savings - not just an engineer's recommendation. Without a quantified business case, nothing gets approved.
Six stages. One complete pollution picture.
Define facility boundaries, waste stream types, and receptor locations.
Input waste composition data. EPA emission factors calculate pollutant generation rates automatically.
Real-time PM2.5, NOx, and CO₂e by source - combustion, fugitive dust, decomposition, and transport.
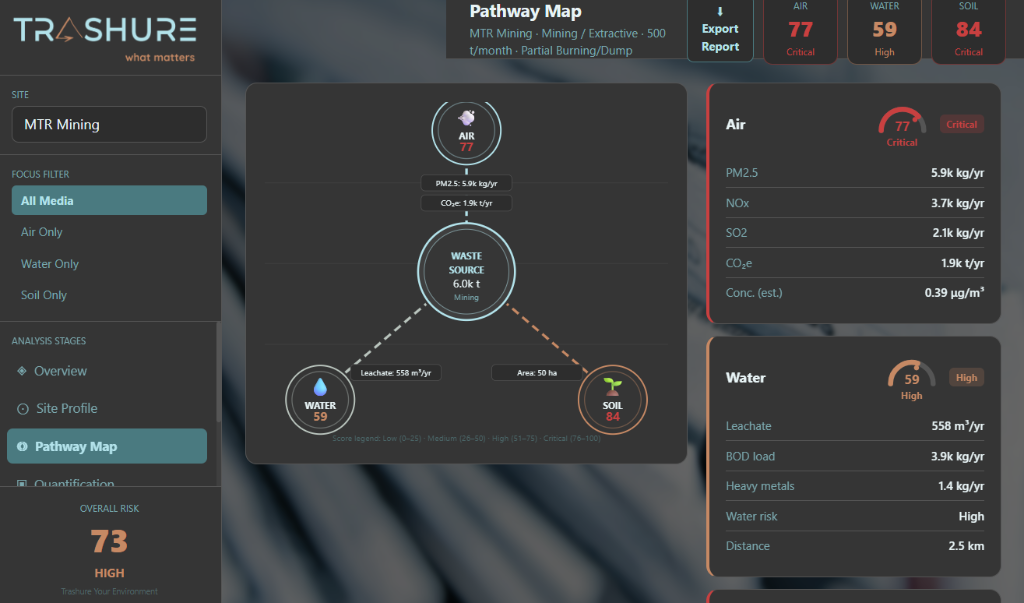
Pathway risk scoring across air, water, and soil. Receptor impact mapping with distance and concentration modelling.
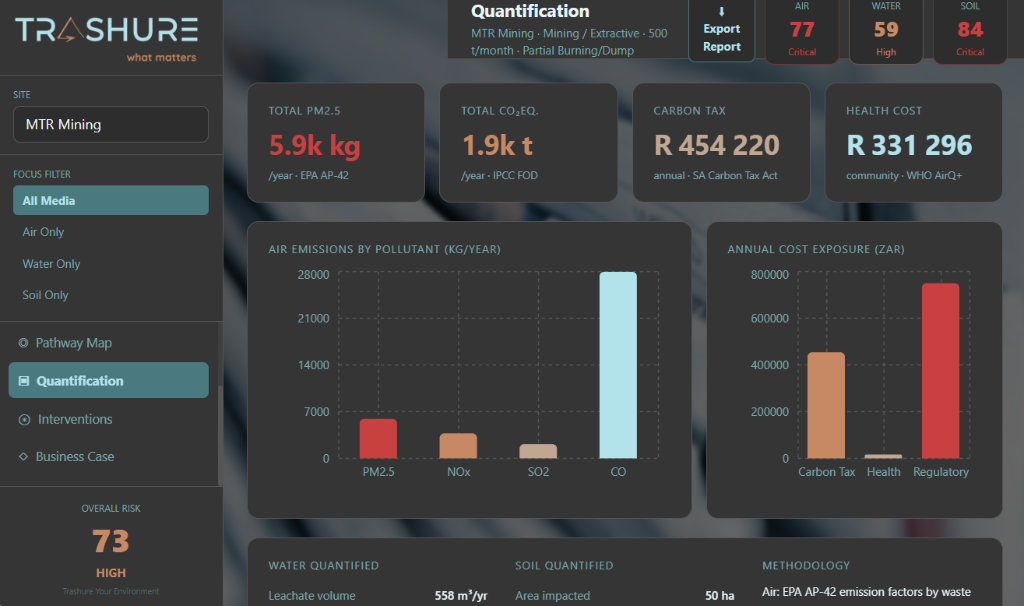
Carbon tax liability, NEM:AQA fine exposure, and community health cost burden - quantified in rands, in real time.
Pollution reduction strategies ranked by ROI, payback period, and CO₂ savings - with a ready-made business case for management approval.
Site Characterisation
Define facility boundaries, waste stream types, and receptor locations.
Waste Stream Characterisation
Input waste composition data. EPA emission factors calculate pollutant generation rates automatically.
Emissions Calculation
Real-time PM2.5, NOx, and CO₂e by source - combustion, fugitive dust, decomposition, and transport.
Risk Assessment
Pathway risk scoring across air, water, and soil. Receptor impact mapping with distance and concentration modelling.
Financial Exposure
Carbon tax liability, NEM:AQA fine exposure, and community health cost burden - quantified in rands, in real time.
Intervention Planning
Pollution reduction strategies ranked by ROI, payback period, and CO₂ savings - with a ready-made business case for management approval.
What your exposure looks like - quantified.
Six documents your compliance team can act on immediately.
Annual Emissions Report
PM2.5, NOx, and CO₂e by source - formatted for DFFE regulatory submission and internal reporting.
Financial Exposure Statement
Carbon tax liability, fine exposure, and health cost burden in rands - updated in real time as inputs change.
Pollution Pathway Risk Map
Air, water, and soil risk scores by receptor and distance - visual, exportable, and audit-ready.
Intervention Business Case
ROI, payback period, and CO₂ savings per intervention - ready to present to your CFO and management.
Compliance Gap Report
Carbon Tax Act, NEM:AQA, and NEMA compliance status with gaps identified and actions recommended.
CO₂ Reduction Roadmap
Prioritised pathway to carbon tax reduction - with timelines, milestones, and cost projections.
Built for South African compliance
Every calculation in Pollutrace® is referenced to its source standard. Outputs are formatted for regulatory submission and are defensible to auditors, the DFFE, and financial institutions requiring environmental due diligence.
Built for these teams
Environmental Engineer
Your primary user. Run full pathway assessments, calculate emissions, and generate compliance reports without engaging external support.
SHEQ Manager
Quantify your facility's regulatory exposure and compliance gaps - and track improvement over time as interventions are implemented.
Sustainability Manager
Build the CO₂ reduction business case your organisation needs - with ROI projections, payback periods, and carbon tax savings your CFO can act on.
Mine Closure / EIA Specialist
Assess long-term pollution pathway risk for closure planning and Environmental Impact Assessments - with DFFE-ready documentation.
See your facility's exposure - before your regulator does.
Request a 45-minute live assessment with one of our environmental engineers. We will run a real pollution pathway assessment using your facility type and waste streams - so you see exactly what your carbon tax liability, fine exposure, and intervention ROI looks like.
Also in the Trashure Your Environment suite
CE Assessment Tool
Map your circular economy opportunities and build a transformation roadmap grounded in the 10R framework.
Learn more →